Key Figures
Access CA Auto Bank key data quickly and concisely.


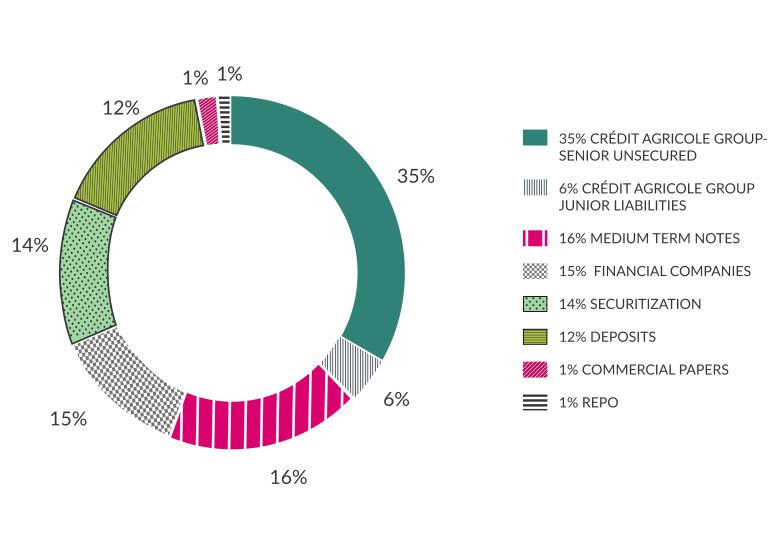
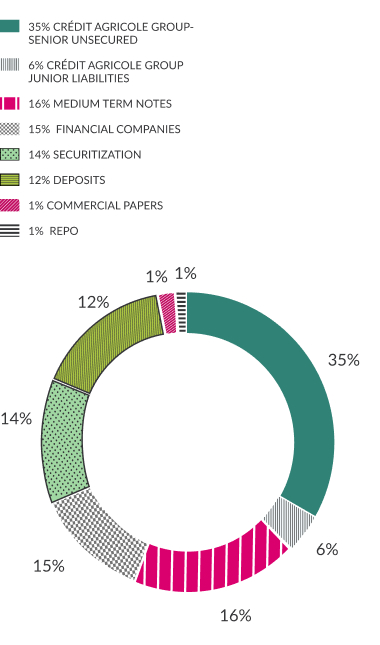
Structure of external financial sources
Net Equity and core tier 1
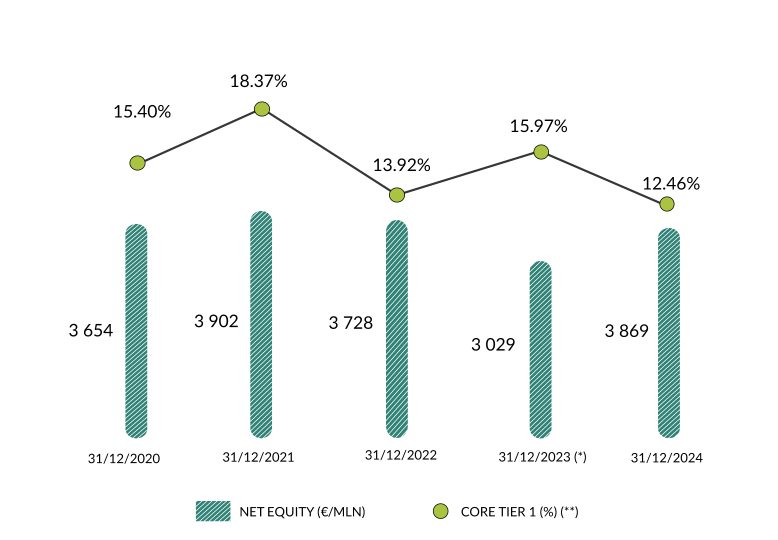
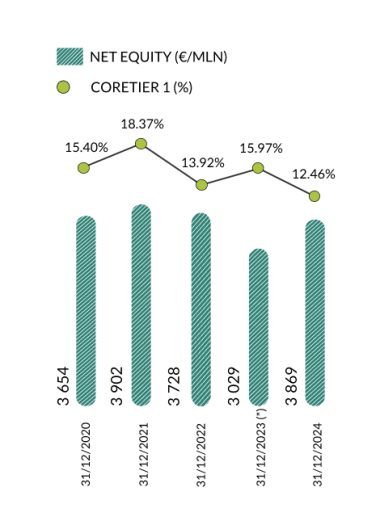
(**) The prudential perimeter ratios, until December 31st, 2023, do not include operating lease companies, which will be included within the banking group as of December 31st, 2024, as required by the CRR3 regulation.
(**) The prudential perimeter ratios, until December 31st, 2023, do not include operating lease companies, which will be included within the banking group as of December 31st, 2024, as required by the CRR3 regulation.
Average portfolio
Average portfolio – White Labels (of which non-exFCA brands)
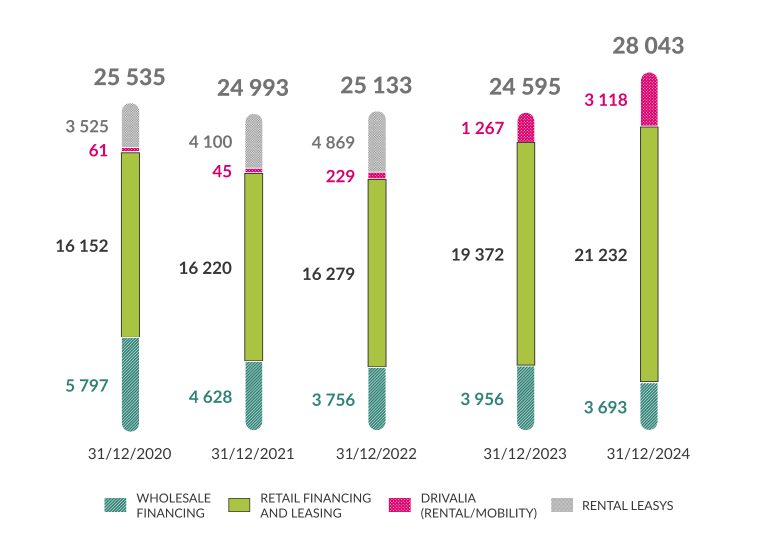
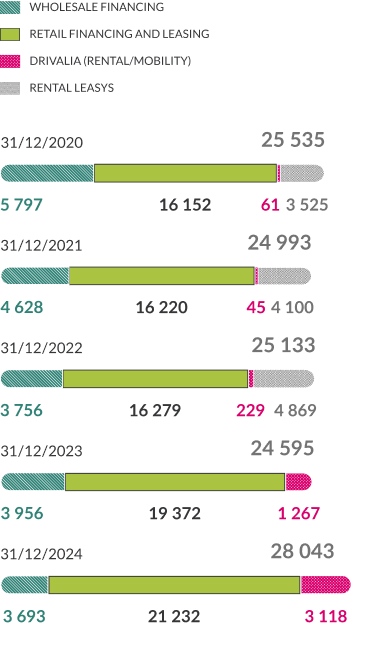
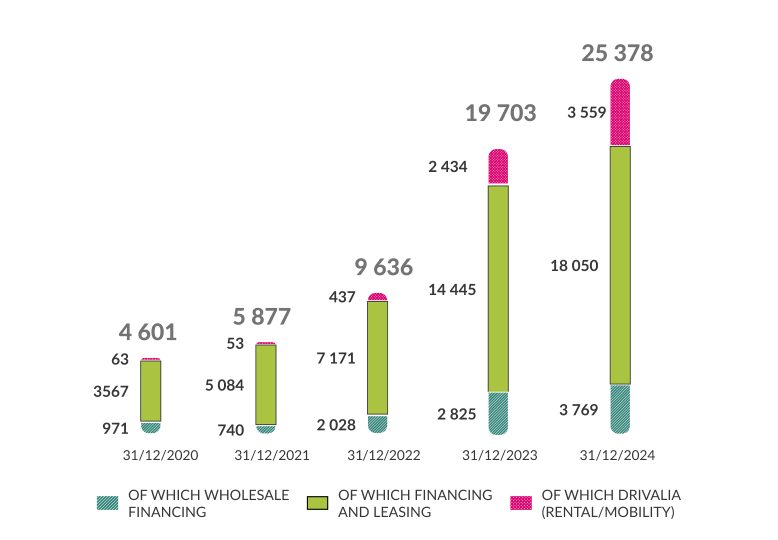
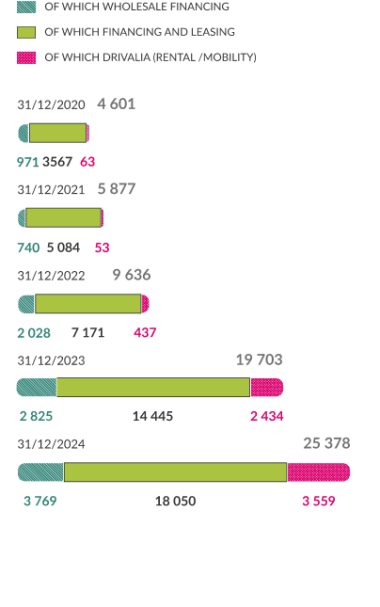
Outstanding end of period
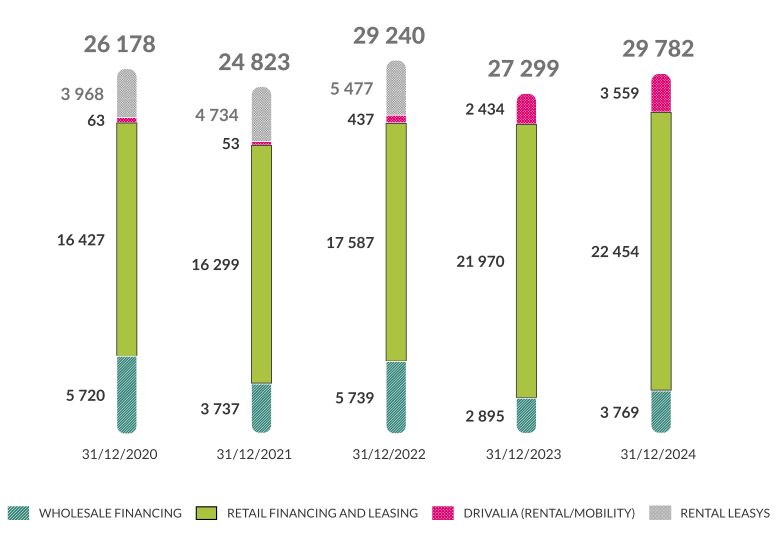
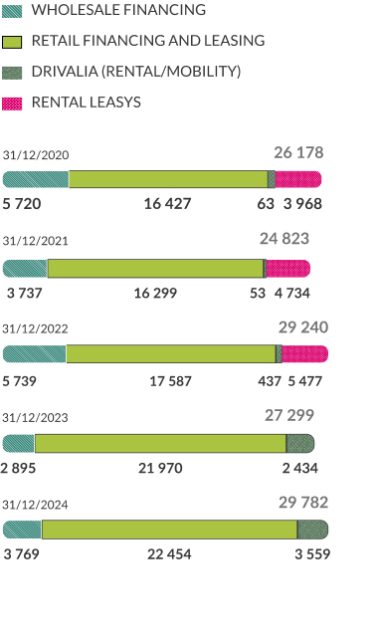
End-of-period by market Portfolio
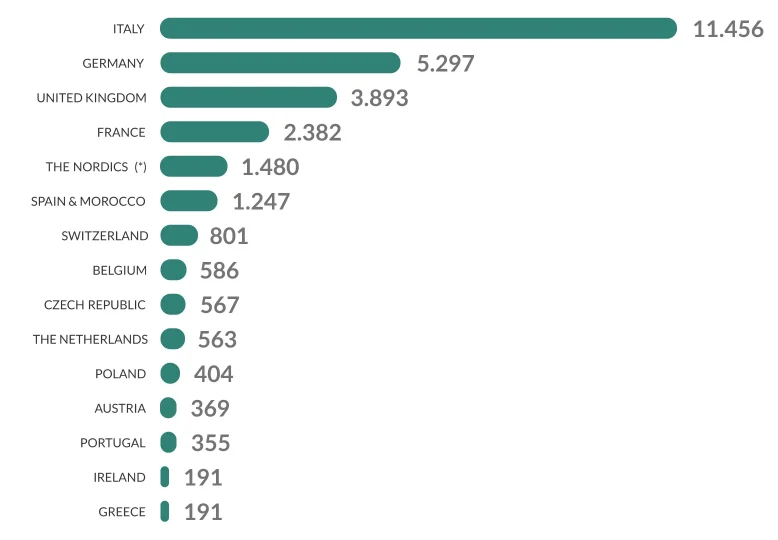
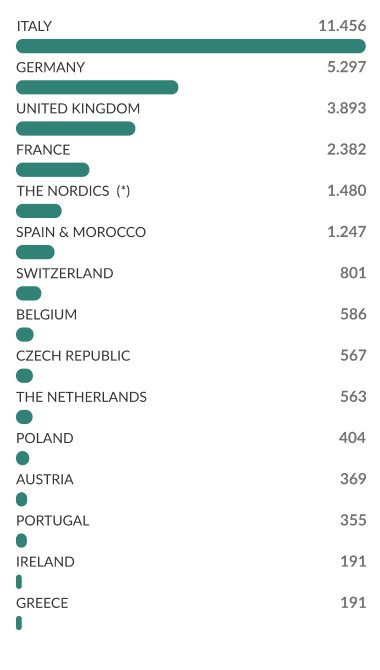
*Nordics Countries: DK, FI, NO, SE
*Nordics Countries: DK, FI, NO, SE
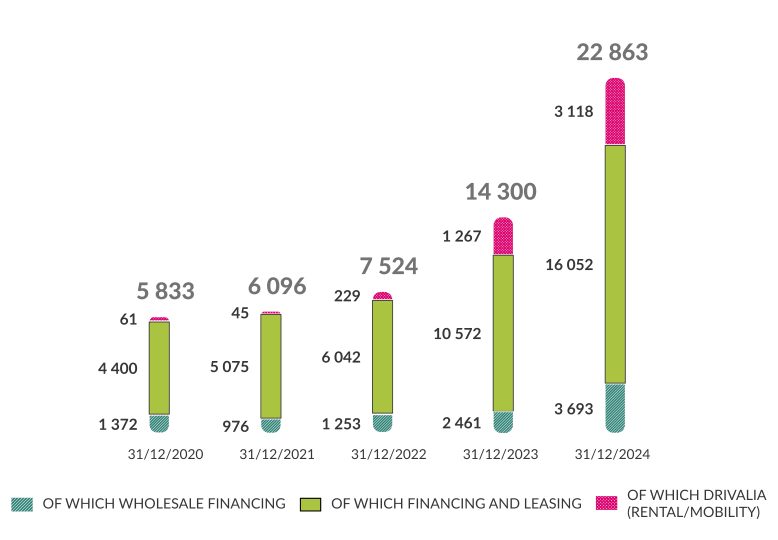
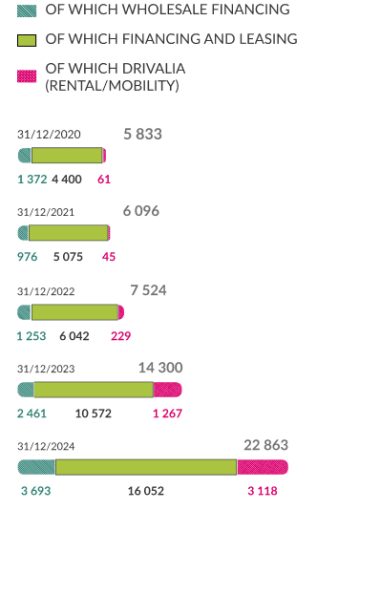
Outstanding end of period – White Labels (of which non-exFCA brands)
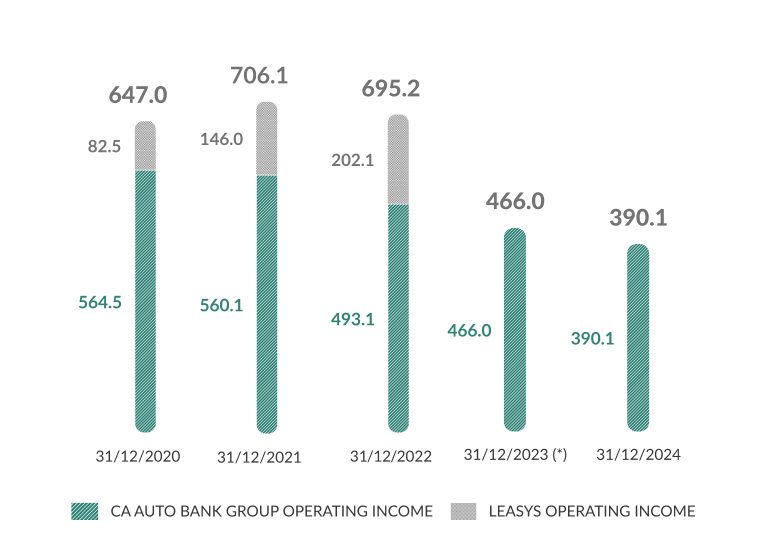
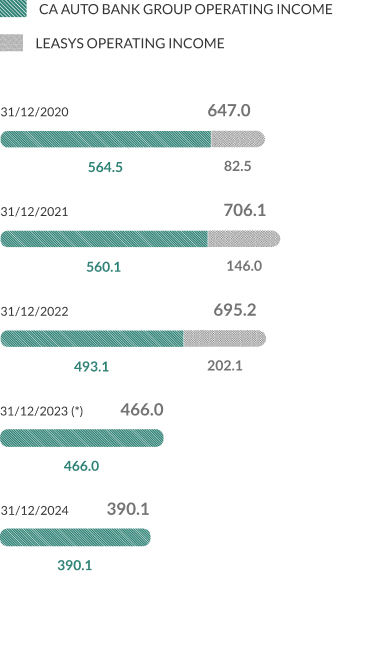
Operating Result
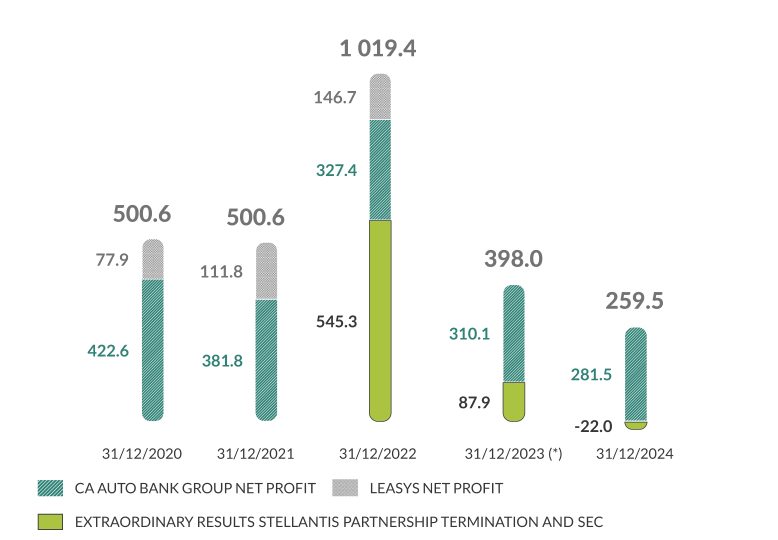
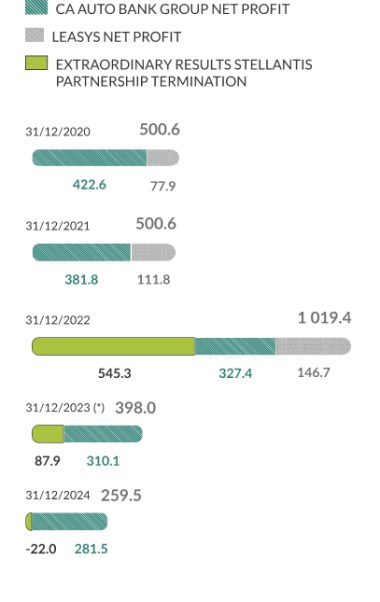
Net Profit
Cost of Risk
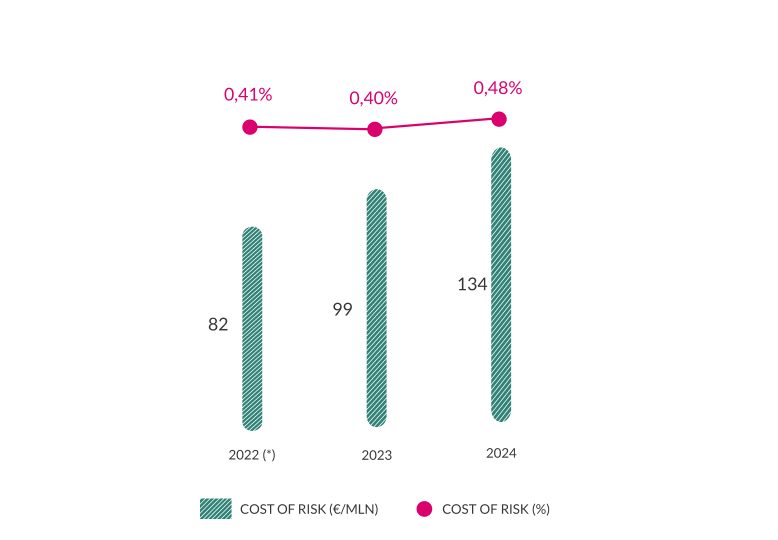
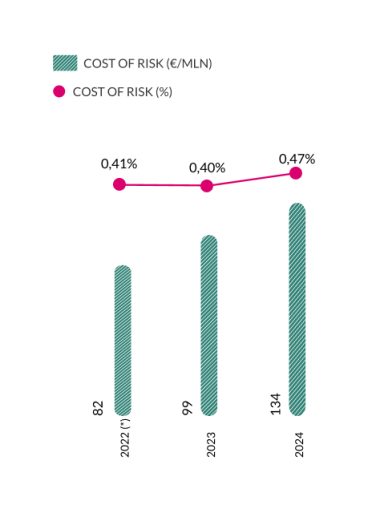
(*) The figures for 2022 have been recalculated excluding the values of Leasys for homogeneity of comparison.
(*) The figures for 2022 have been recalculated excluding the values of Leasys for homogeneity of comparison.