Key Figures
Access CA Auto Bank key data quickly and concisely.


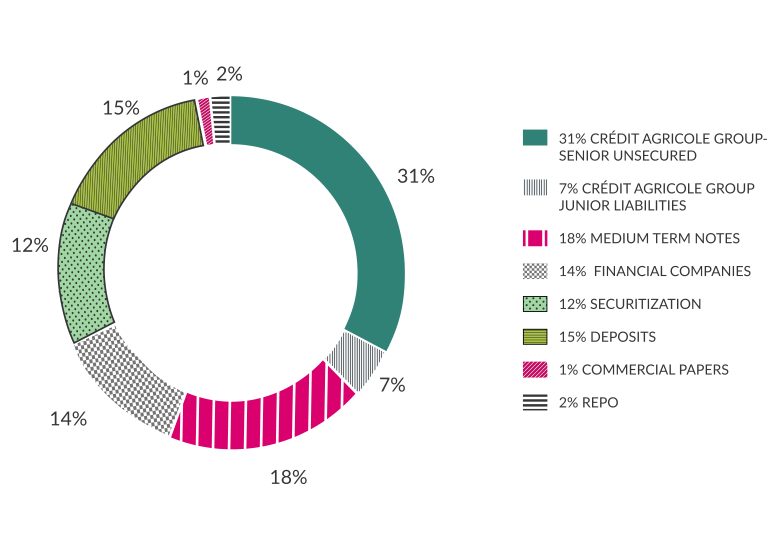
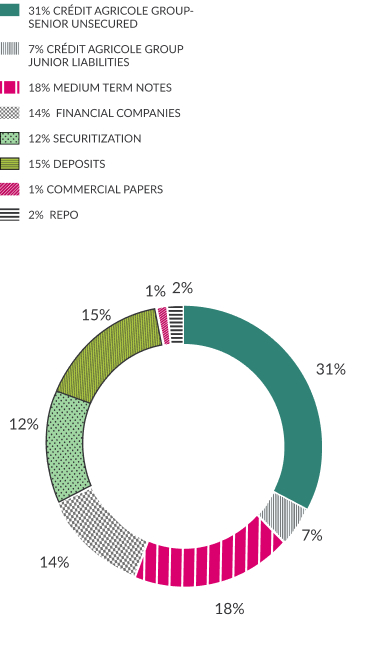
Structure of external financial sources
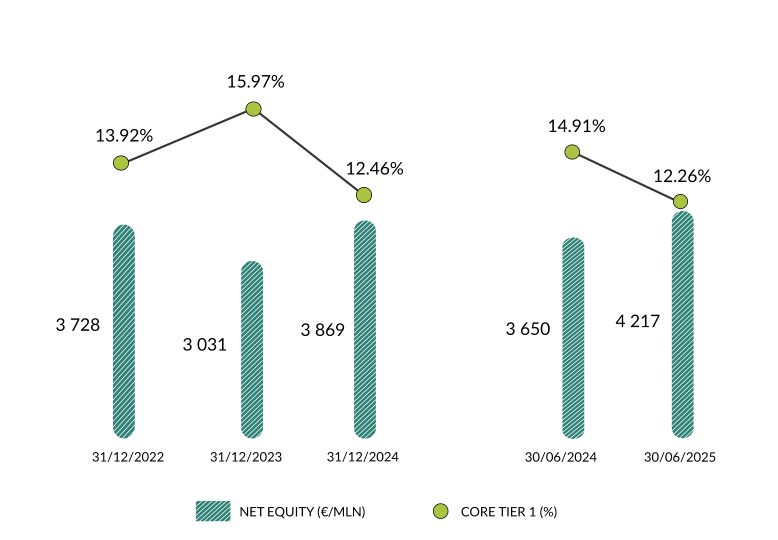
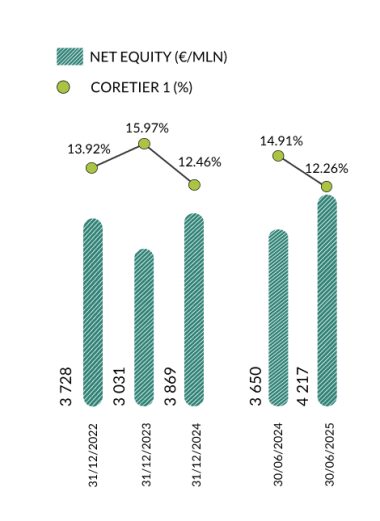
Net Equity and core tier 1
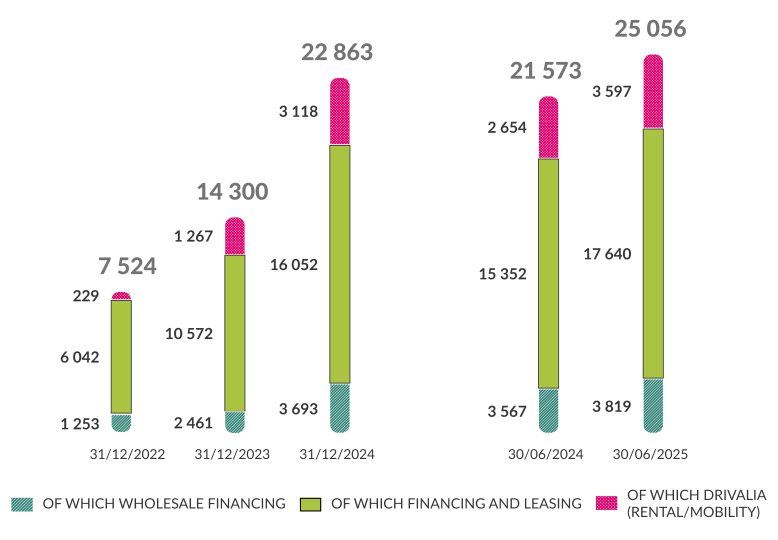
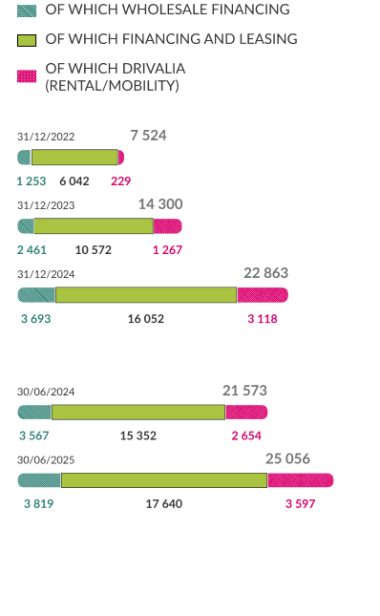
Average portfolio
Average portfolio – White Labels (of which non-exFCA brands)
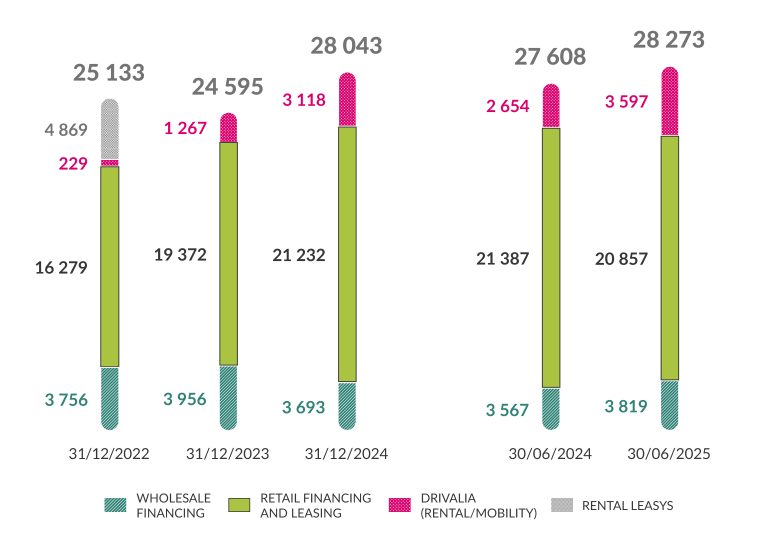
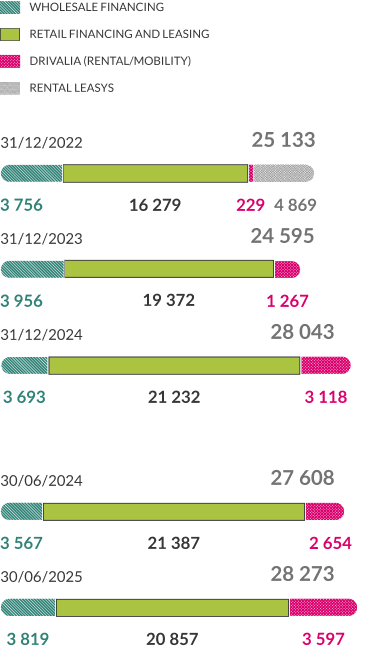
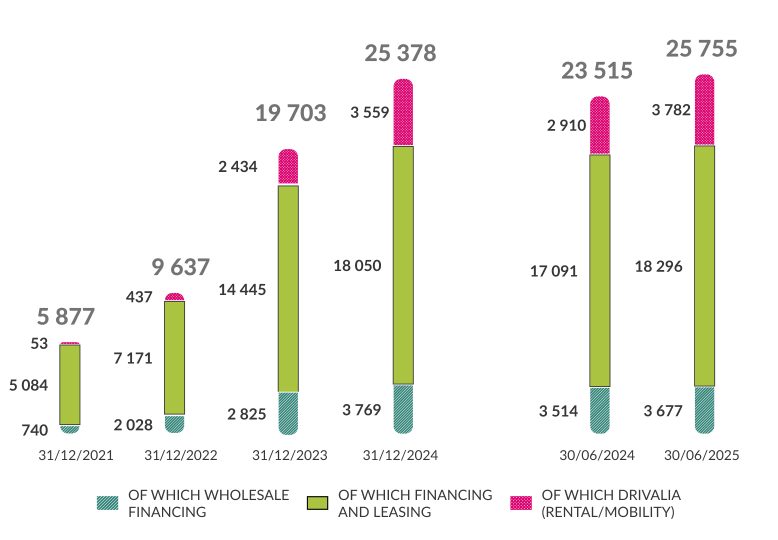
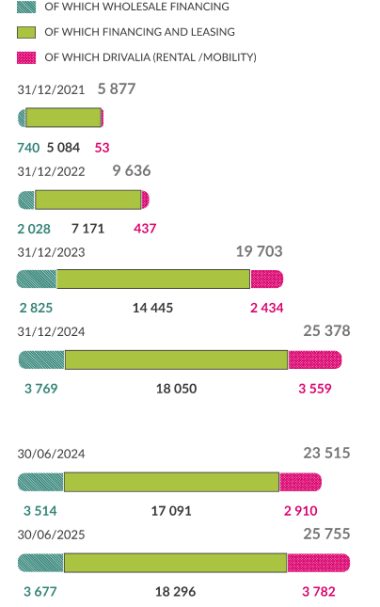
Outstanding end of period
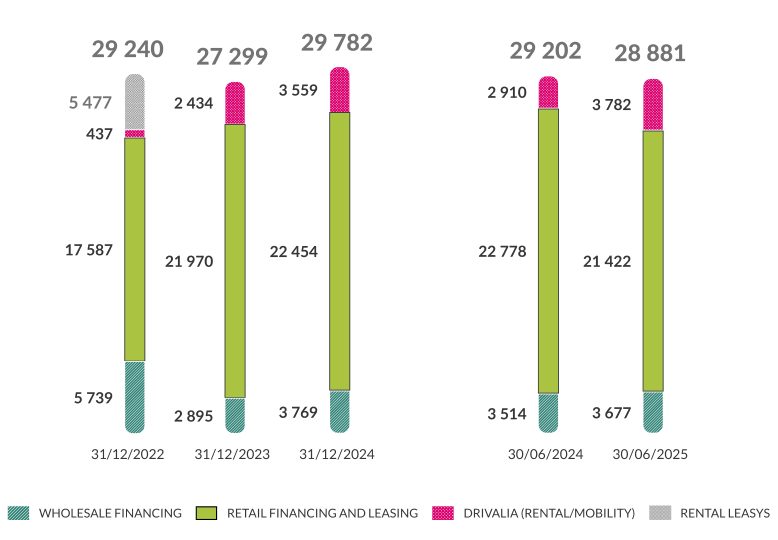
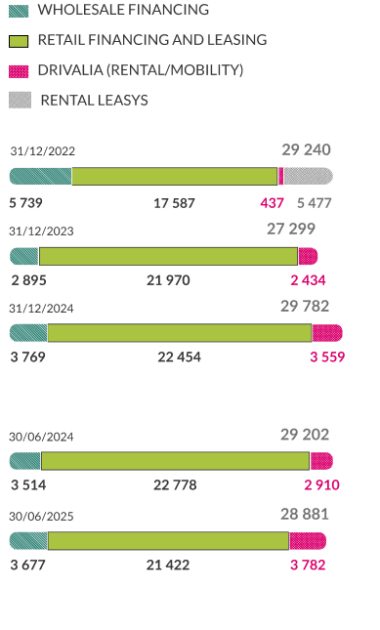
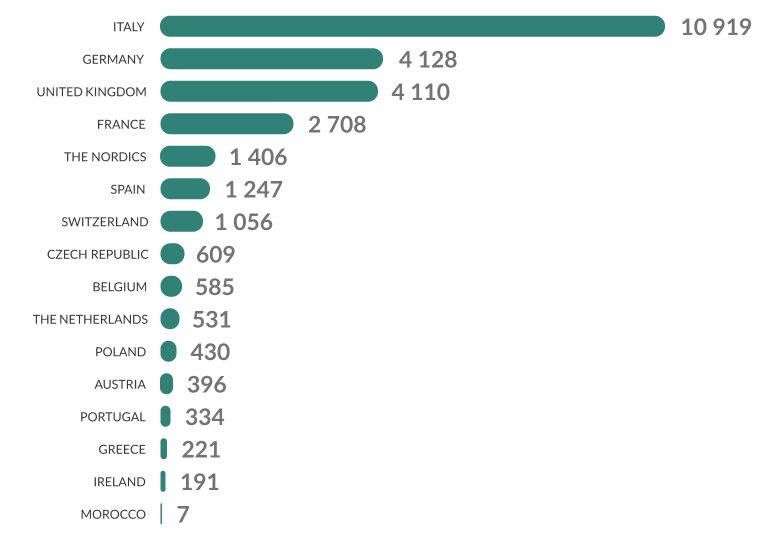
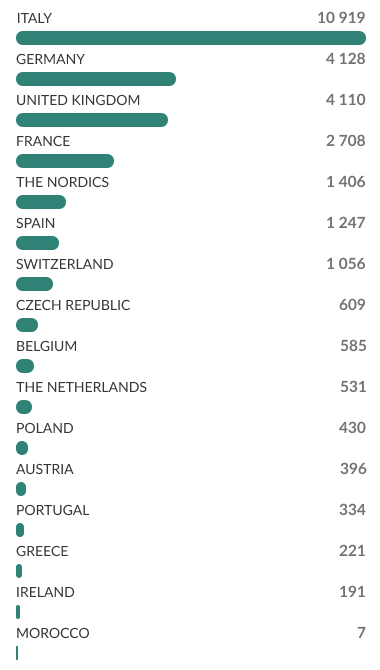
End-of-period by market Portfolio
Outstanding end of period – White Labels (of which non-exFCA brands)
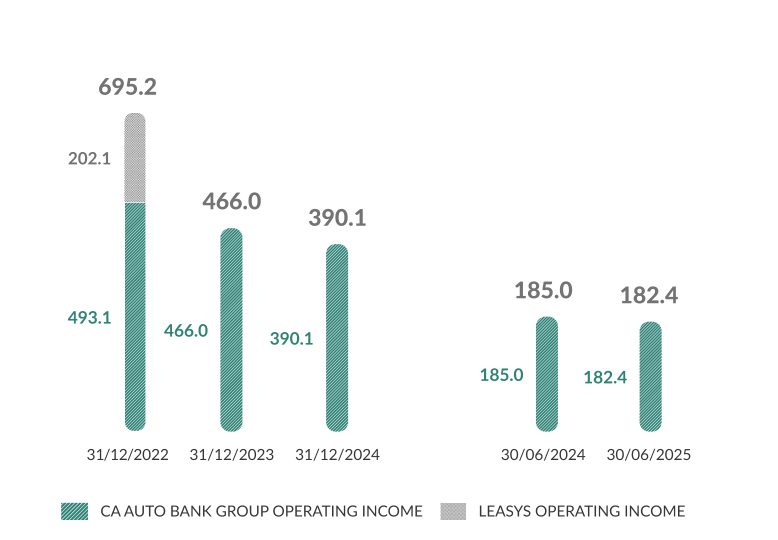
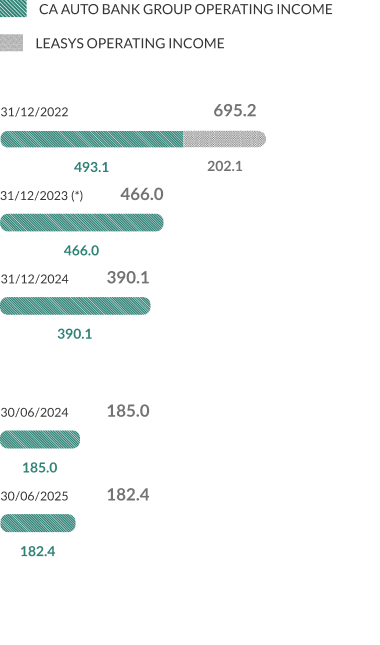
Operating Income
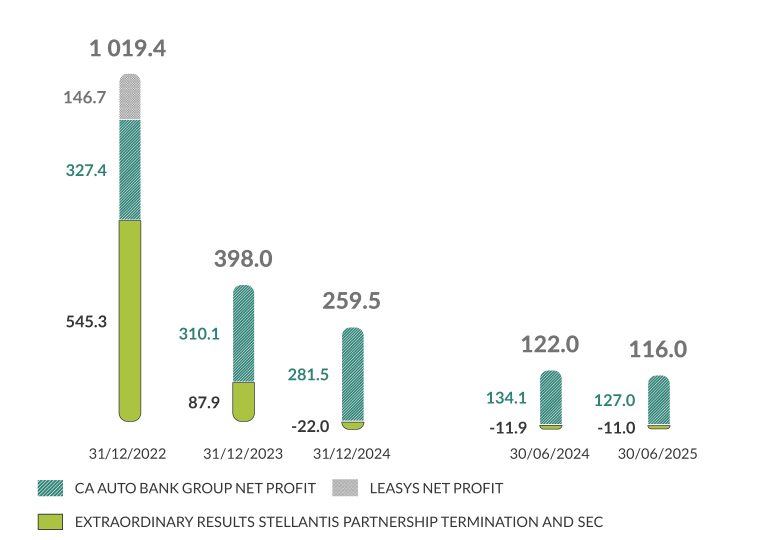
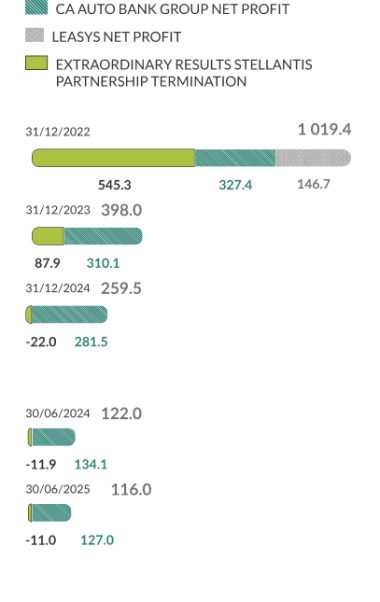
Net Profit
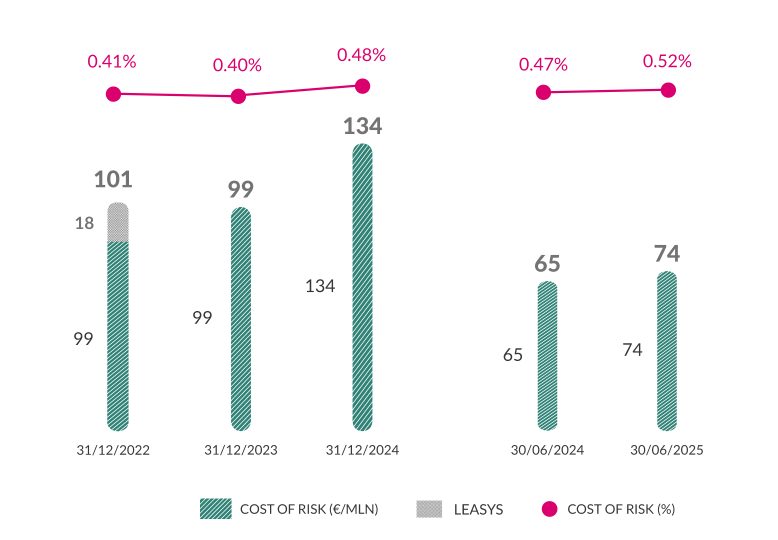
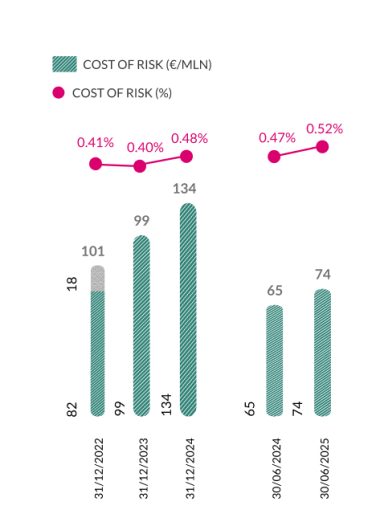
Cost of Risk